In the previous posts (I and II), we examined the data compiled by the National Crime Records Bureau (NCRB) in 2016 on the response of the police at the national level and in the four Southern States. We noted that the pendency rates of investigation and the number of cases closed on the ground of being ‘false’ were significant.
In this post, we move to the next stage of the criminal process i.e. the courts and their performance in respect of crimes against Scheduled Castes (SCs) and Scheduled Tribes (STs). We will compare the data from Andhra Pradesh (AP), Karnataka, Kerala and Tamil Nadu (TN) with the national figures for 2016.
The Trial
Scheduled Castes
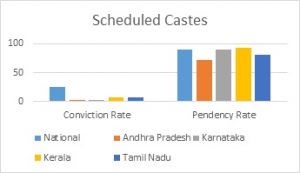
In 2016, 1,44,979 cases were sent for trial of which only 15,148 cases (10.4%) were disposed of while 1,29,831 cases (89.6%) were pending trial at the end of the year. Of the cases disposed of, only 3,753 cases (25.7%) resulted in convictions and 462 cases (3.04%) were compounded. This is despite the fact that the Scheduled Castes and Scheduled Tribes (Prevention of Atrocities) Act, 1989 (Act) does not contain any provision permitting compounding of offences.

In comparison, AP, Karnataka, Kerala and TN reported abysmal conviction rates of 3.2%, 2.8%, 7.7% and 7.7% respectively. AP saw the lowest pendency rate of 72.3% and Kerala the highest (92.6%) while Karnataka (89.3%) and TN’s (80.6%) figures hovered around the national average.
Scheduled Tribes
23,408 cases were sent for trial in 2016, of which 3,022 cases (12.9%) were disposed of, leaving 20,386 cases (87.1%) pending at the end of the year. Of the cases disposed of, only 602 cases (20.8%) resulted in convictions, while 88 cases were compounded.

In the four Southern States, conviction rates for crimes against STs were abysmal in 2016. 8.2%, 11.1% and 1.1% cases resulted in convictions in Kerala, TN and AP. Shockingly, no case resulted in a conviction in Karnataka.
Pendency rates in Karnataka (86.8%) and TN (88.2%) were along the lines of the national average (87.1%). Once again, Kerala recorded the worst pendency of 91.3%, despite designating all District Sessions Courts as Special Courts and additionally establishing two Exclusive Special Courts, under S.14 of the Act. AP was the only State to report a lower pendency rate (75.1%). One reason for AP’s better pendency rates in respect of offences against SCs and STs, when compared to the other three States, could be because it has established 24 Exclusive Special Courts in addition to designating all District Sessions Courts as Special Courts.
Once again, the time taken for disposal of cases by courts and the reasons for high pendency rates is not presented in the NCRB data. Further, as highlighted in our previous post, the data between 2014-16 on the performance of both police and courts is not comparable as the NCRB Reports of 2014 and 2015 do not present State wise data in this regard.
However, data on police and court performance with respect to specific offences is available at the national level in the NCRB Reports from 2014 to 2016. This will provide some insight into the nature and extent of crimes against SC and ST women. Therefore, in the following post, we will examine disaggregated data with respect to specific offences against SC and ST women between 2014-16, and the response of police and courts to such atrocities.
– This post was authored by Deekshitha Ganesan, Research Associate

